 Human
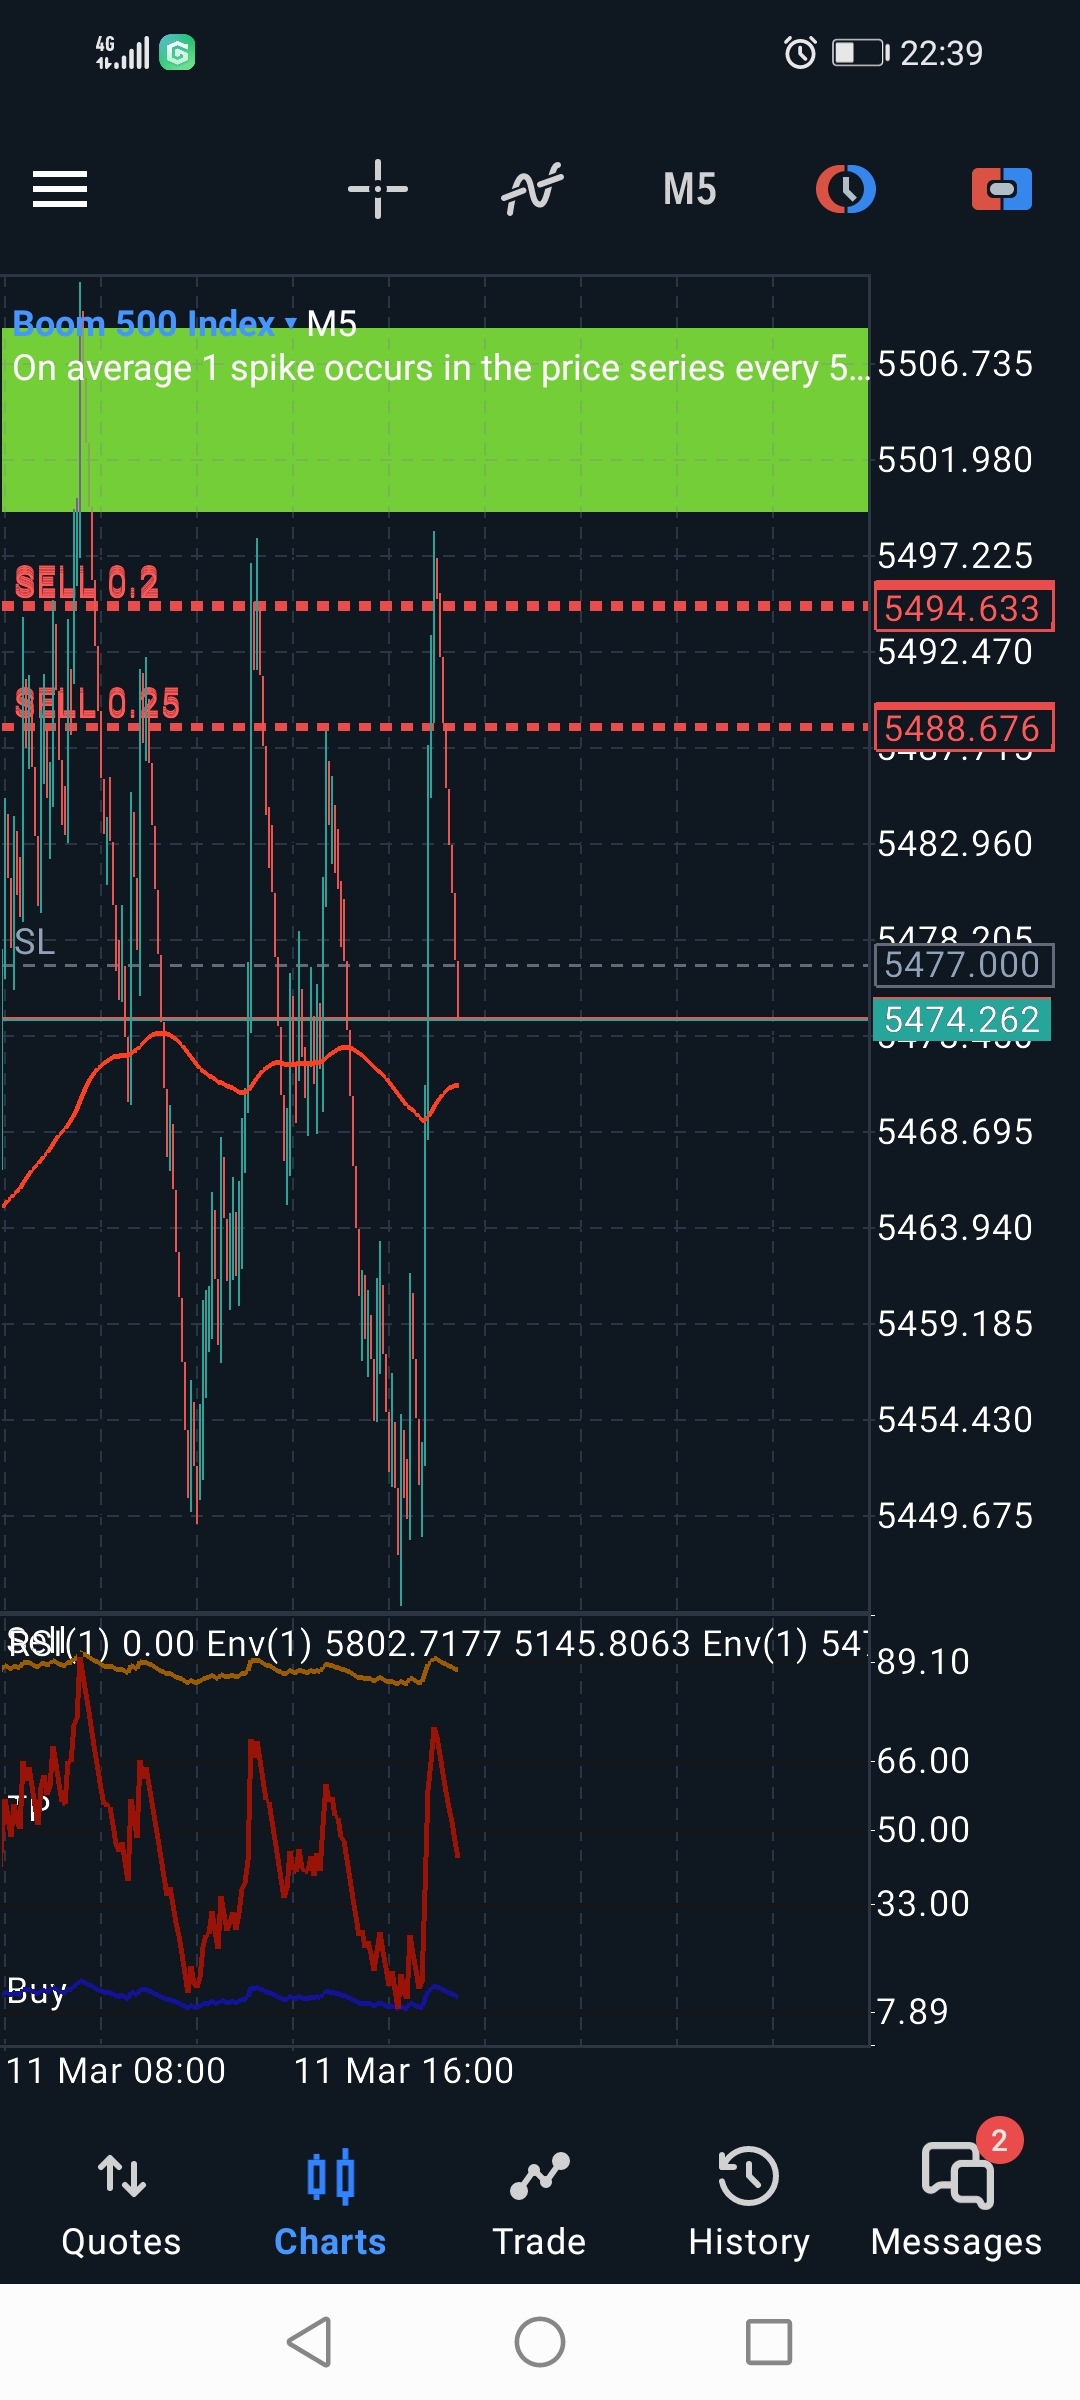
HumanA 'Human' generated image showing a financial trading chart. It displays candlestick patterns, volume indicators, and moving averages. Red and green colors indicate price movement directions. This is a five-minute chart of a market index. Our analysis indicates that this image is highly likely a human-made creation. No NSFW content detected.
AI technology offers valuable insights, but it's not perfect. For best results, we recommend additional human verification. This tool should not be used for authenticity checks as images can be manipulated through other tools that do not use AI.
Is Your Image AI-Generated?
Instantly analyze your own photos with our free AI detection tool. Get detailed results just like this analysis.
AI Detection Summary
- Detection Result: Human
- Probability Score: 90%
- Confidence Level: Highly likely
- NSFW Content Detected: No
- NSFW Probability Score: 100%
Raw Analysis Data
{"predicted_label":"Human","probability":0.9,"NSFW":"No","NSFW_probability":1}Copy Link To This Analysis: