Analysis by Is It AI?
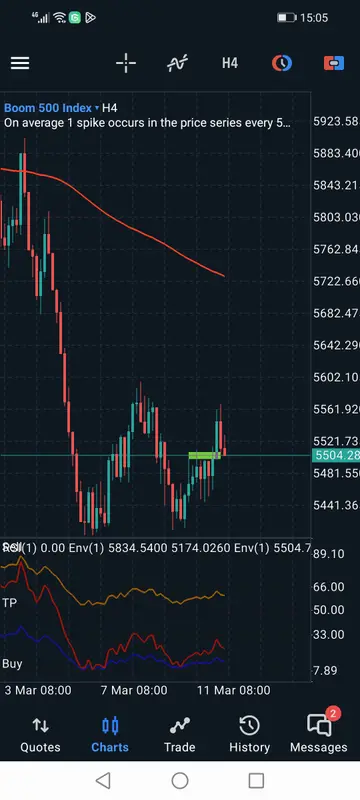
Boom 500 Index Price Chart
Human generated chart displaying Boom 500 Index price movements over time with technical indicators like RSI and moving averages.
Analysis by Is It AI?
Human generated chart displaying Boom 500 Index price movements over time with technical indicators like RSI and moving averages.
We classified this image as likely human-made with 74% confidence.
Is It AI? uses deep-learning models trained on millions of labeled images, spanning both camera-captured photographs and outputs from contemporary generators like Midjourney, DALL-E, Stable Diffusion, Nano Banana, Flux, and others. The models analyze each image for pixel-level artifacts, frequency-domain noise patterns, and generator-specific signatures that the human eye typically misses.
The result is a probabilistic detection signal, not absolute proof. For high-stakes decisions like newsroom verification, fraud investigation, or evidence review, combine it with source verification, metadata review, reverse image search, and human judgement.
Camera-captured photographs tend to carry physical fingerprints that AI models still struggle to reproduce. Common cues:
These are heuristics, not guarantees. A skilled retoucher or a newer generator can defeat any single cue. Always cross-check.
A user chose to publish it. Detection results on IsItAI.com are private by default; only user-published results have a public page.
No. The result is a detection signal based on visual patterns, not absolute proof. For high-impact decisions, combine it with source verification, metadata review, reverse image search, and human review.
No. A public result page is created only when a user explicitly chooses to publish their result.
Is It AI? achieves 95%+ accuracy across 20+ major AI image generators in independent third-party benchmarks. Accuracy varies by generator and image content, so we recommend testing with your own images and using the result as one signal alongside source verification.
Free account: monthly detections, full history, and the option to publish results like this one.