🚀 Is It AI? Extension 2.0 is here! Completely rebuilt with Chrome's Side Panel, one-click sign-in, automatic history sync, and usage tracking at a glance. Faster, cleaner, and works on more sites than ever.Add to Chrome →
Analysis by Is It AI?
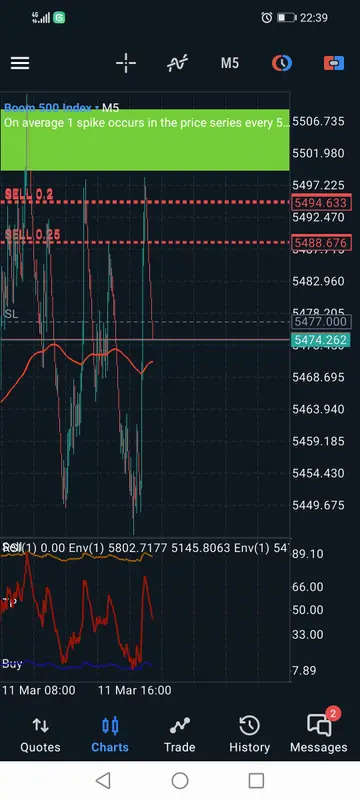
Financial Trading Chart Analysis
A 'Human' generated image showing a financial trading chart. It displays candlestick patterns, volume indicators, and moving averages. Red and green colors indicate price movement directions. This is a five-minute chart of a market index.
Why this verdict can be trusted
95%+Detection accuracy on independent benchmarks
20+AI generators detected, including the latest
MillionsLabeled images used to train the detection models
Detects:
Midjourney
DALL-E 3
Stable Diffusion
Nano Banana
ChatGPT Image
Adobe Firefly
FLUX
Ideogram
Kling AI
Sora
What we analyzed
We classified this image as likely human-made with
90% confidence.
How Is It AI? classifies images
Is It AI? uses deep-learning models trained on millions of labeled images,
spanning both camera-captured photographs and outputs from contemporary
generators like Midjourney, DALL-E, Stable Diffusion, Nano Banana, Flux, and
others. The models analyze each image for pixel-level artifacts,
frequency-domain noise patterns, and generator-specific signatures that the
human eye typically misses.
The result is a probabilistic detection signal, not absolute proof. For
high-stakes decisions like newsroom verification, fraud investigation, or
evidence review, combine it with source verification, metadata review,
reverse image search, and human judgement.
Common signs of human-made images
Camera-captured photographs tend to carry physical fingerprints that AI models still struggle to reproduce. Common cues:
Natural skin texture with visible pores, fine asymmetry, and stray hairs
Consistent lighting, shadows, and reflections that match a single light source
Sharpness that falls off with depth-of-field, not uniformly across the frame
EXIF metadata that survived (when available) showing camera, lens, and capture date
These are heuristics, not guarantees. A skilled retoucher or a newer generator can defeat any single cue. Always cross-check.
About public detection results
A user chose to publish it. Detection results on IsItAI.com are private by default; only user-published results have a public page.
No. The result is a detection signal based on visual patterns, not absolute proof. For high-impact decisions, combine it with source verification, metadata review, reverse image search, and human review.
No. A public result page is created only when a user explicitly chooses to publish their result.
Is It AI? achieves 95%+ accuracy across 20+ major AI image generators in independent third-party benchmarks. Accuracy varies by generator and image content, so we recommend testing with your own images and using the result as one signal alongside source verification.
We use cookies to analyze site usage and improve your experience.
Privacy Policy
Cookie Preferences
Choose which types of cookies you'd like to allow. Your preferences will be saved and you can change them at any time via the Cookie Preferences link in the footer.
Necessary
Always Active
Essential cookies that enable core site functionality like security, session management, and accessibility. These cannot be disabled.
Analytics
Help us understand how visitors interact with our site by collecting anonymous usage data. Includes Google Analytics and Microsoft Clarity.
Marketing
Used to deliver relevant ads and measure ad campaign effectiveness. Includes Meta Pixel, Google Ads remarketing, and Google AdSense.